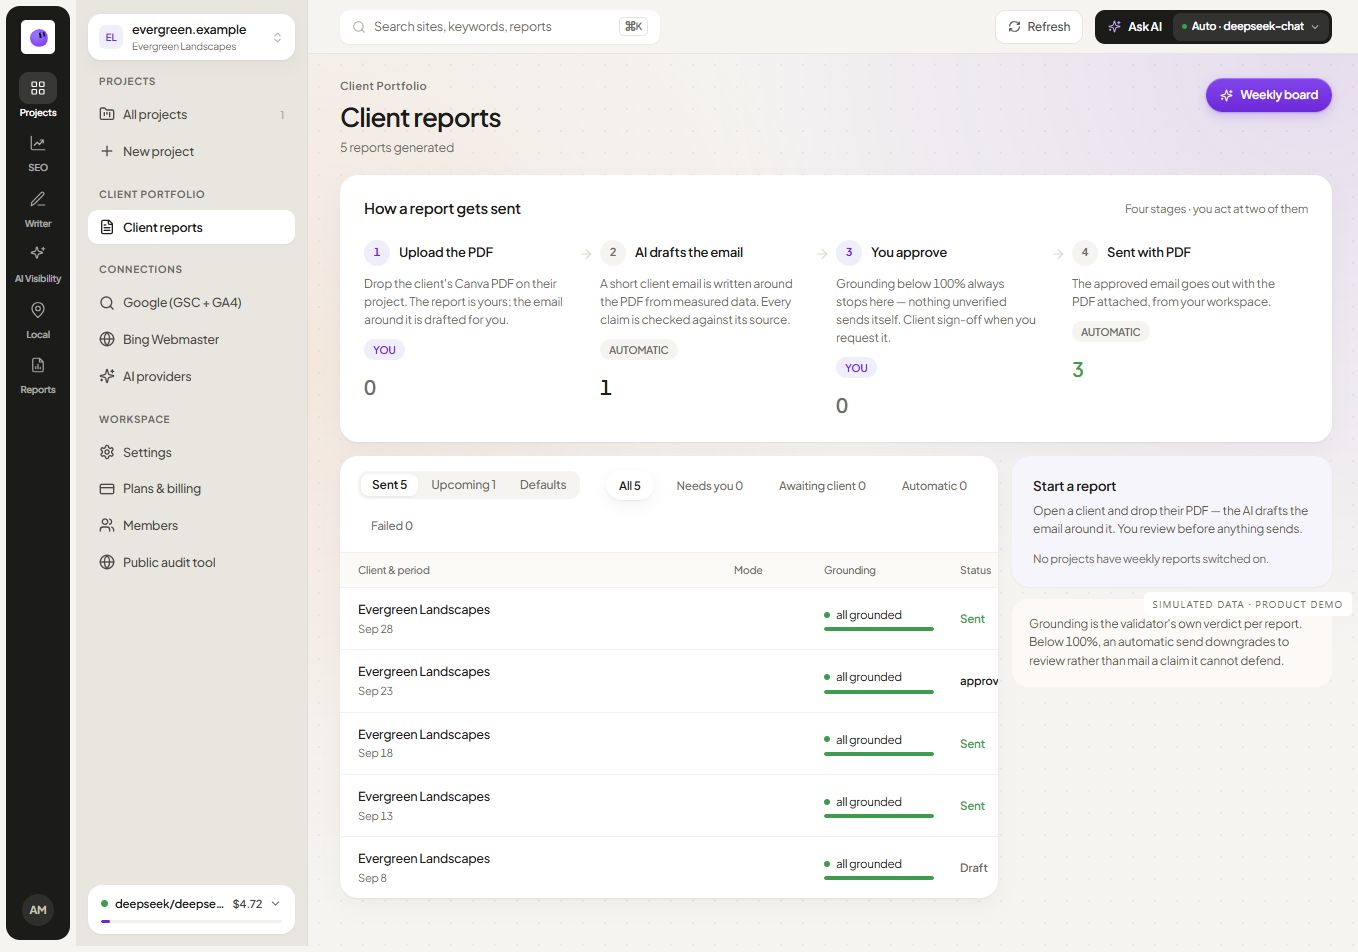
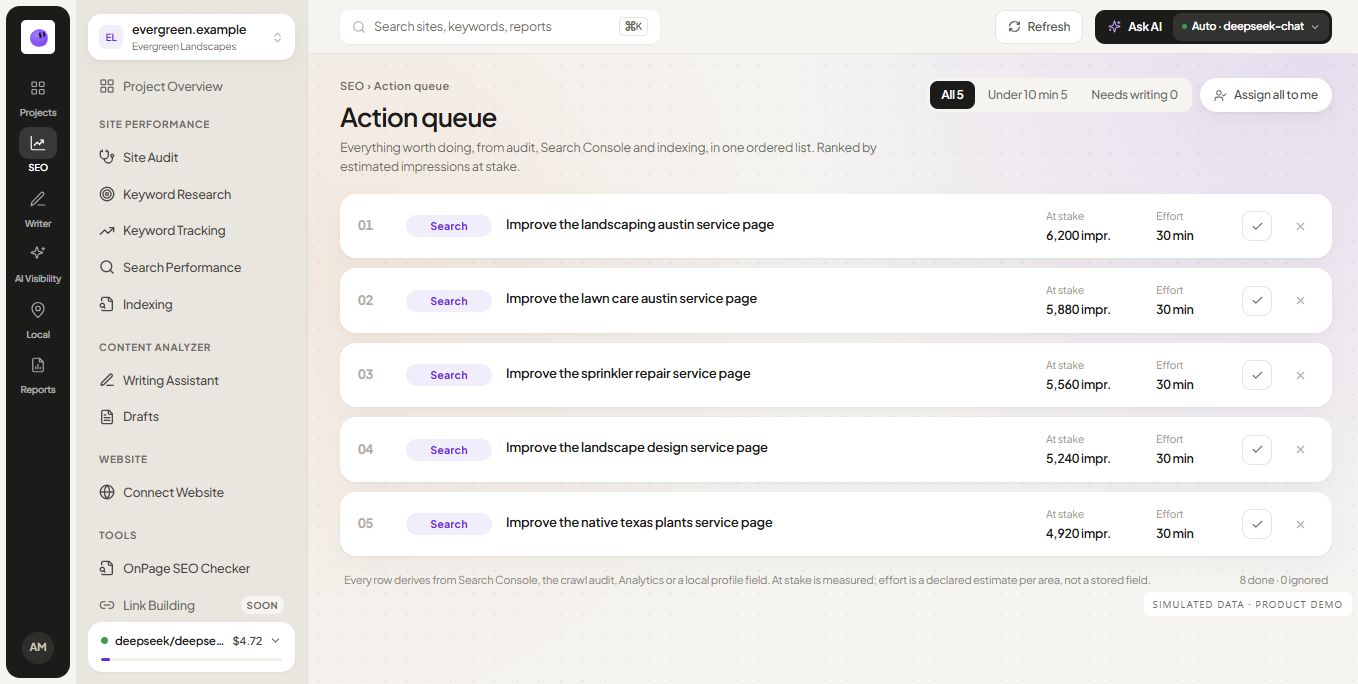
Copy the editable Markdown report into your preferred editor. Replace the illustrative figures with verified data from your own sources.
What the report includes
| Section | What to record | Why the reader needs it |
|---|---|---|
| Scope | Website, dates, comparison period, audience | Establishes what the report covers |
| Executive summary | Main change, implication and next action | Makes the decision easy to find |
| Search performance | Clicks, impressions, CTR, relevant queries/pages | Explains visibility and search response |
| Website outcomes | Relevant Analytics measures and key events | Connects visits with defined site actions |
| Completed work | Changes made and verification evidence | Shows what the team actually delivered |
| Priorities | Owner, action, expected signal and review date | Turns the report into work |
Keep the detailed tables available, but lead with the decision. A client does not need to interpret every metric before finding out what you recommend.
Choose the format and reporting period
The supplied download is an editable Markdown document. It is suitable for a text editor or a document workflow that accepts pasted Markdown; inspect the tables after importing. It is not an Excel workbook, a connected dashboard or an automatically refreshed Google Sheets report.
For a monthly SEO report, record calendar dates and whether the comparison uses the previous month, an equal number of days or the previous year. An executive summary for an owner can stay short while the supporting worksheet retains definitions and calculations.
Decide which metrics belong in the report
| Question | Useful evidence | Interpretation check |
|---|---|---|
| Are relevant searchers finding us? | Impressions, clicks, query and landing-page groups | Separate branded demand from discovery queries where the data permits |
| Are search appearances producing clicks? | Click-through rate and search-result context | A different query mix can change the average without a page defect |
| What happens after arrival? | Organic sessions and verified key events | Check event definitions and attribution before calling an event a lead |
| Which content needs attention? | Page-level search movement and completed changes | Keep moved URLs and measurement gaps visible |
| Is technical work complete? | Verified fixes and unresolved blockers | A health score is a summary, not a traffic outcome |
| Does link acquisition matter this period? | Relevant referring-domain observations from an identified source | Do not equate every new link with a quality endorsement |
Only include a backlink or AI visibility section when you have relevant, attributable evidence. The template can record external observations; that does not mean RankZap supplies every dataset listed here.
A filled executive-summary example
Illustrative example, not customer performance: Search clicks increased from 400 to 460 across equal reporting periods. The service-page group accounted for 45 of the 60 additional clicks. Recorded inquiry submissions increased from 12 to 13. We will inspect inquiry quality and the queries behind the service-page gain before expanding that page group.
This example separates the change from its interpretation. Click growth is 15%, calculated as (460 - 400) / 400. The inquiry count is small, so one additional submission should not support a broad conversion claim. The proposed action is to inspect the evidence that could explain the movement.
How to use the template
- Choose a business question and reporting audience.
- Use clearly labeled current and comparison periods.
- Export or connect the relevant source data.
- Check page groups, countries, devices and filters before comparing values.
- Record the actual work completed during the period.
- Write the executive summary after reviewing the detail.
- Assign a small number of next actions with review dates.
For a fuller explanation, read the SEO reporting guide. Use the audit report template when the deliverable is a findings register rather than a monthly performance report.
Keep search metrics separate from website outcomes
Search Console describes search performance; Analytics describes measured activity on the site. Their collection and attribution methods differ, so the values should not be forced to match. Preserve source names and explain which metric supports each conclusion.
An SEO ranking report can be included as a section. State which keywords, locations, devices and check dates are represented. A tracked position and Search Console average position answer different questions. Neither, by itself, proves that a visitor became a customer.
Adapt the report to the client
For a local business, focus on useful service pages, location context and qualified inquiries. For a SaaS business, inspect relevant landing pages, trial starts and activation when measurement supports them. For an agency portfolio, keep the shared report structure while choosing metrics that reflect each client's objective.
Remove unused sections. Leaving an empty AI visibility chart or an irrelevant local section in every report makes the document harder to understand. A clear note explaining an unavailable source is better than treating missing information as zero.
Frequently asked questions
Is this a monthly SEO report template?
Yes. The structure works for monthly reporting and can be adapted to another cadence. Keep the comparison dates explicit and account for differences such as month length, campaign timing or seasonal demand.
Should every report include rankings?
Include them when tracked keywords support the client's decision. Keep the actual search and business outcomes visible too, so the report does not become a list of position changes without context.
Can I change the example figures?
Replace all illustrative figures before using the report for a real client. Retain the source and calculation notes so another person can check the explanation.
Can RankZap help prepare the report?
Explore reporting for agencies and white-label reports to see how connected project data fits into the reporting workflow.