This guide shows a repeatable reporting process using a fictional service business. The numbers are illustrative and are not RankZap customer results. Use the editable SEO report template to apply the structure to your own verified data.
Start with the decision the reader needs to make
Before opening a dashboard, write the purpose of the report. “Review last month's traffic” describes an activity. “Decide which service pages should receive the next month of work” describes a decision.
For an owner, the useful questions may concern qualified inquiries and the services attracting them. For a content editor, the priority may be identifying pages that need a better answer. For an agency account manager, the report also needs to explain completed work and decisions that require the client's input.
Agree on the reporting period, comparison, responsible reviewer and delivery date. Define the business action being counted. A submitted quote request and a click on a phone number may both be useful, but they are different events and should have different labels.
Build a source contract
A source contract is a short record of where each reported metric comes from and how it was filtered. It makes the report reproducible when another person takes over.
| Field | Example to record |
|---|---|
| Website | The canonical production domain |
| Search source | Correct Search Console property and search type |
| Analytics source | Correct GA4 property and stream |
| Reporting period | Explicit start and end dates |
| Comparison | Prior equivalent period or relevant prior year |
| Market | Country filter, or clearly labeled worldwide data |
| Business event | Verified quote-request submission |
| Known gaps | Tracking outage, missing connection or partial period |
Do not combine numbers from different country filters without explanation. Record the source timezone if a boundary matters. Check that the available data covers the selected period before publishing a percentage change.
Keep the measurement stages separate
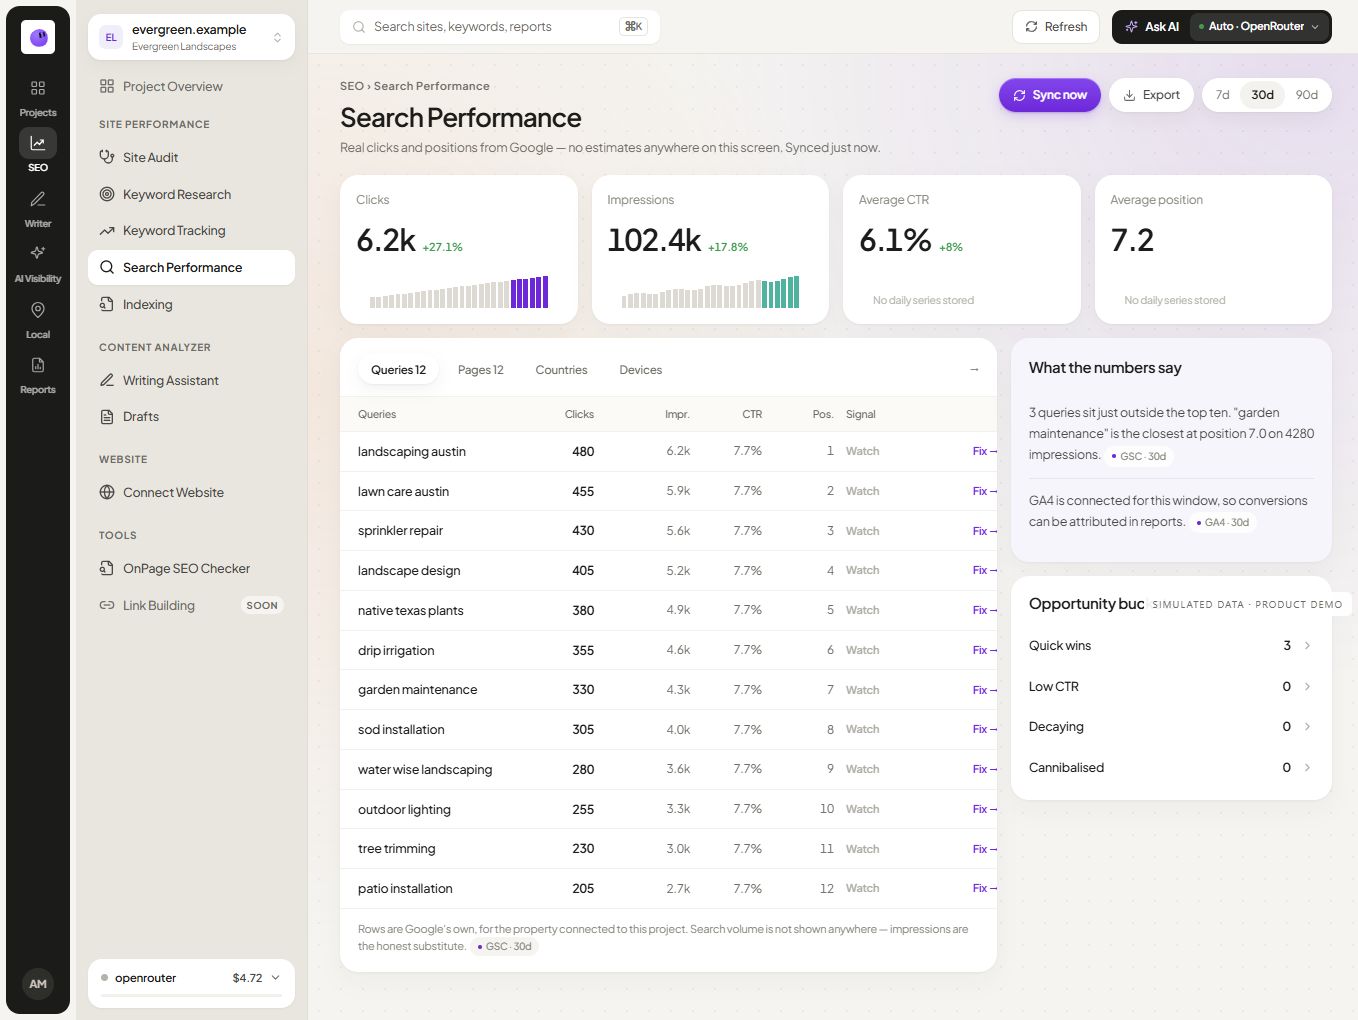
Search impressions describe appearances in search. Search clicks describe visits initiated from those appearances under the source's measurement rules. Analytics sessions describe on-site activity under a different system. A qualified lead is a business outcome that may require additional validation.
These stages can help explain a journey, but the totals do not have to match. Consent, attribution, filtering and implementation can affect the record. If a discrepancy changes the conclusion, investigate it rather than quietly replacing one source with another.
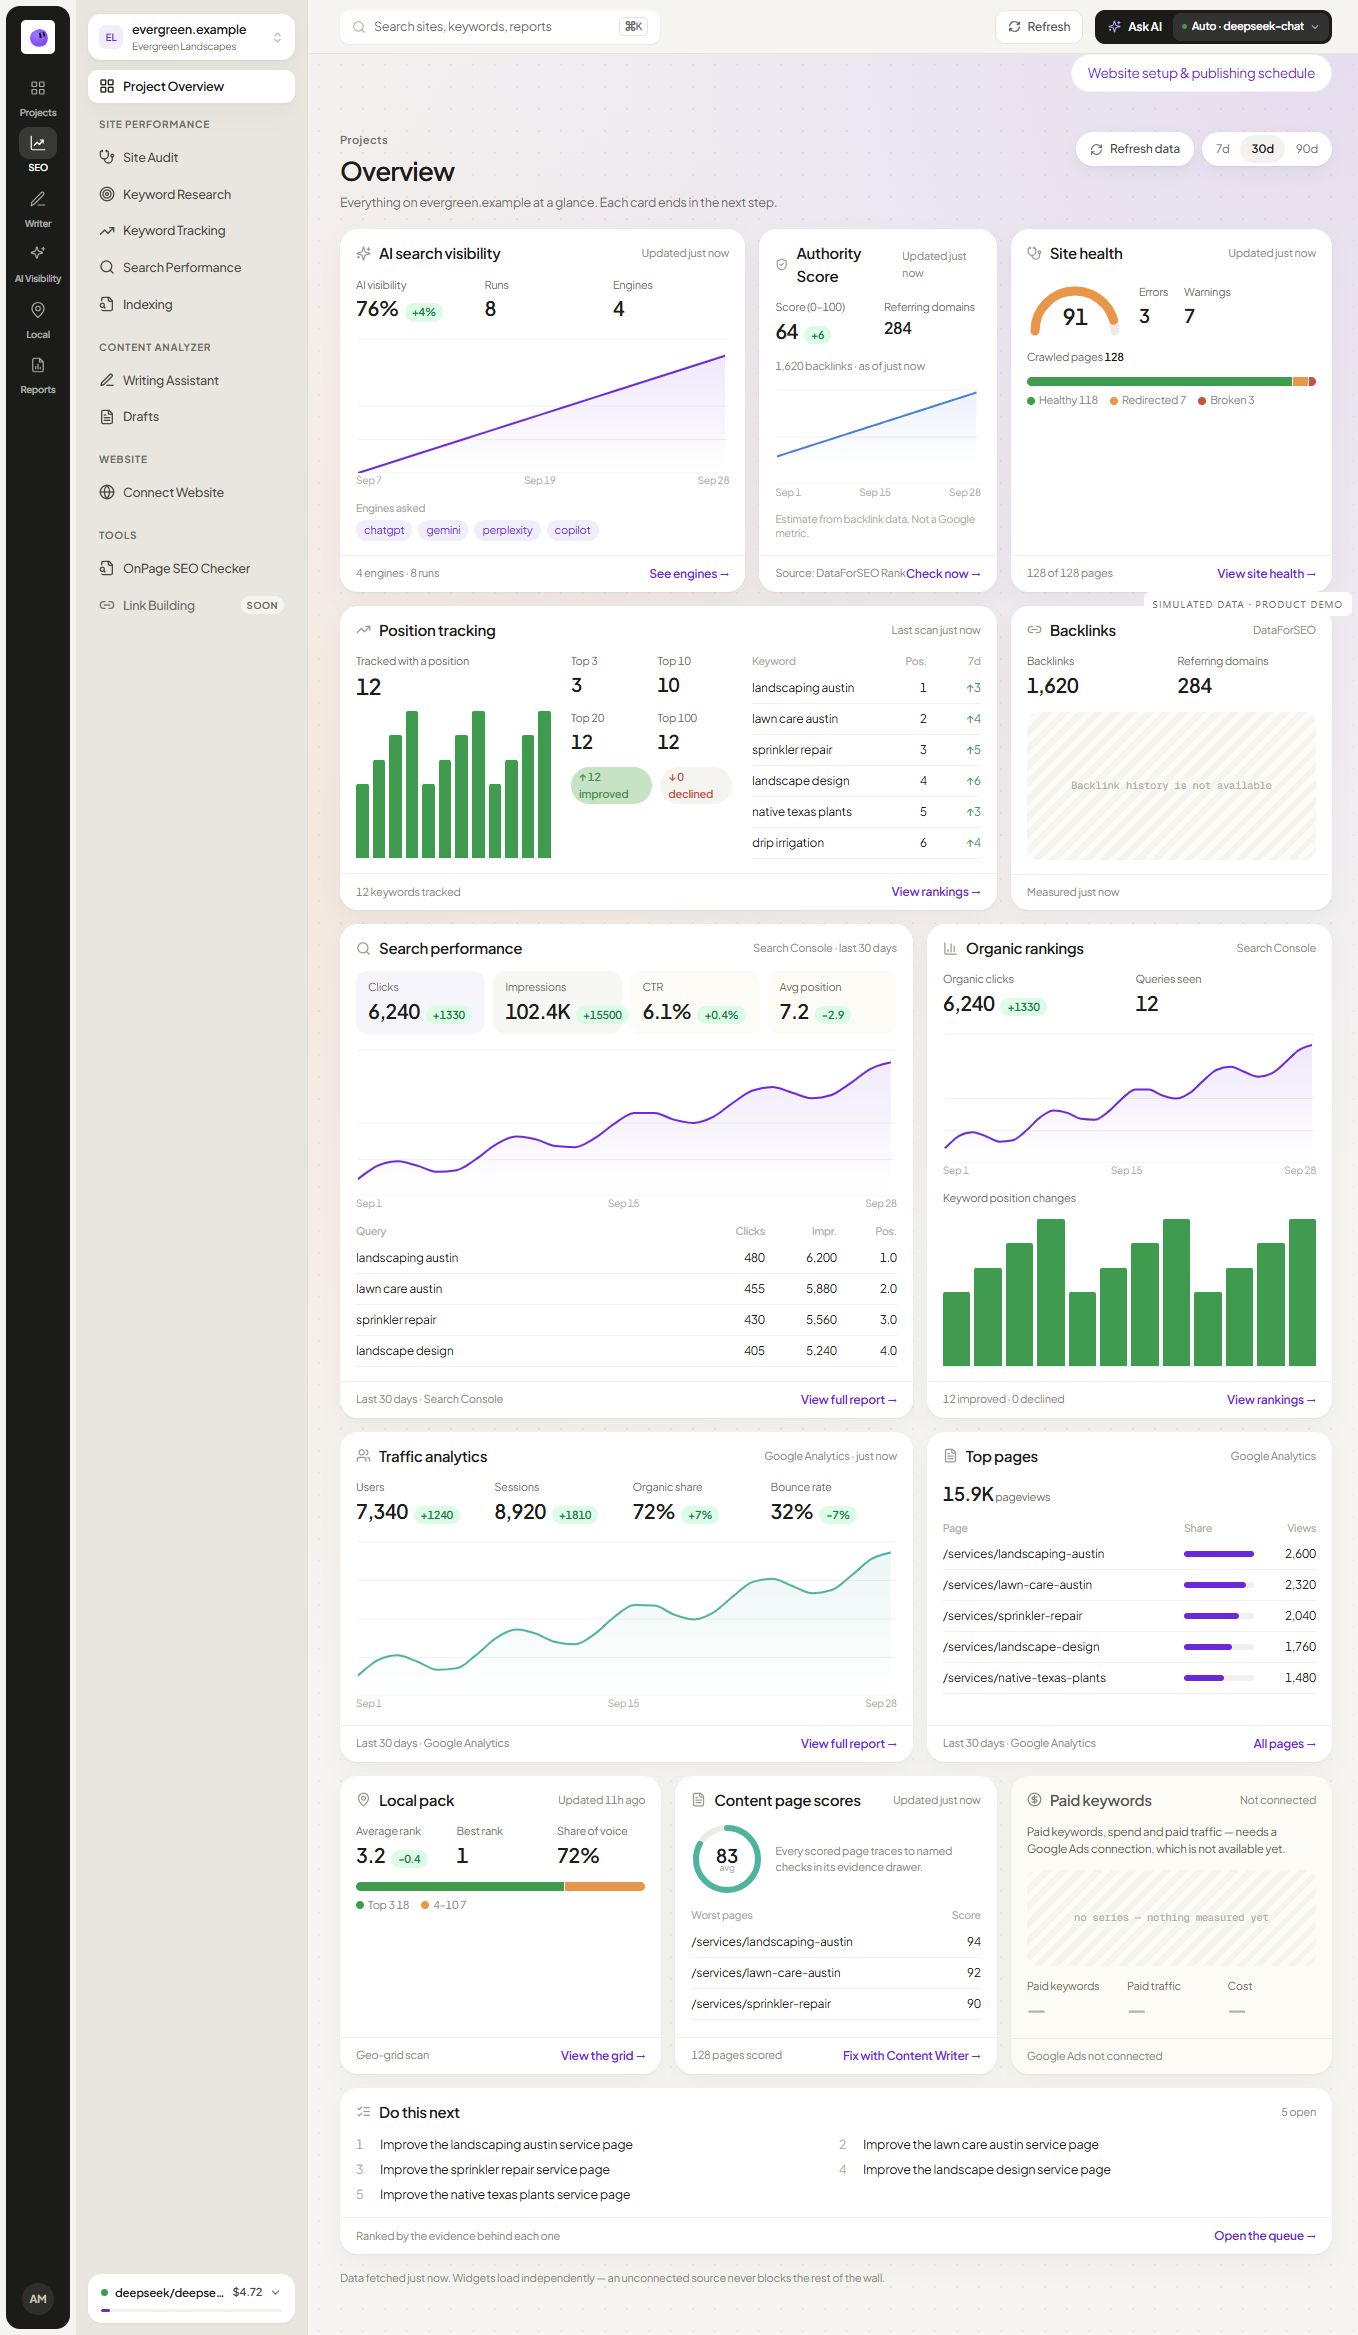
For a service website, a compact report might include search clicks, important landing pages, verified inquiries and the status of priority fixes. A large catalogue may need product or category groups. Choose a stable set that fits the business, then add detail only when it supports a decision.
Calculate changes transparently
For a nonzero baseline, percentage change is (current - previous) / previous × 100.
In this fictional example, organic search clicks increase from 400 to 460. The difference is 60 clicks and the relative increase is 15%. Quote requests increase from 12 to 13. That is one additional request, or about 8.3% relative growth.
| Measurement | Previous | Current | Change |
|---|---|---|---|
| Search clicks | 400 | 460 | +60; +15% |
| Verified quote requests | 12 | 13 | +1; approximately +8.3% |
The two changes can appear in the same summary, but these totals alone do not prove that the additional search clicks caused the additional request. Preserve that distinction.
If the previous value is zero, do not divide by zero or report an infinite improvement. Show the absolute change and say that a conventional relative percentage is not available. If the previous period is missing, label it missing rather than entering zero.
Find where the movement happened
Aggregate growth can hide a decline on the most valuable pages. Group pages by a meaningful business purpose, such as service, location, category or editorial guide. Use the same grouping across periods.
Suppose 45 of the 60 additional clicks came from installation pages and the remaining 15 came from other pages. The installation group contributed 75% of the total increase. That is an observation worth reporting. It is not yet evidence that a particular title edit produced the increase.
Inspect the relevant queries, countries, devices and dates. Check whether a new page entered the report, an old URL moved or the grouping changed. A consistent group definition matters as much as the chart itself.
Choose KPIs by business model
A key performance indicator should help the reader make the agreed decision. A SaaS team may examine qualified trial starts or activation; a service business may review verified inquiries; an ecommerce team may investigate organic landing-page activity and attributed purchases. Verify the measurement before using a familiar label.
Separate branded and non-branded query groups when the available data supports it, and document the grouping rule. Brand demand and discovery demand can move differently. Keep sensitive or unavailable queries out of invented totals.
CTR is clicks divided by impressions for a compatible scope. If a fictional page receives 20 clicks from 1,000 impressions, its CTR is 2%. A later CTR of 3% is an increase of one percentage point, or 50% relative growth. State which calculation you mean. Average position also needs query and device context; it is not a single fixed ranking for the whole site.
Compare manual templates, dashboards and scheduled reports
A template provides a repeatable narrative structure. A dashboard supports exploration of connected data. A scheduled report delivers a selected view on a cadence. Choose the form that suits the recipient, and confirm whether the output is a fixed snapshot or changes when the source refreshes.
If you need to report return on investment, define the attributed value, included costs and attribution limits first. A traffic increase alone cannot provide the revenue input. When those inputs are missing, report the observable outcomes and explain the measurement work still needed.
Use three layers in the narrative
1. Observation
State what the source shows: “The installation page group gained 45 clicks over the comparison period.” Include the scope so the statement can stand alone.
2. Interpretation
Explain a plausible reason and the supporting evidence: “Most of the increase came from queries about maintenance costs. The page was expanded during the period, although seasonality and other changes have not been ruled out.”
3. Action
Name the next step: “Review the cost section for unanswered questions, check its internal links and inspect inquiry quality before expanding the topic.”
This structure gives readers useful judgment without turning a hypothesis into a fact. A report can be decisive about the next investigation even when the cause remains uncertain.
Report completed work with verification
A list of activities is more useful when each entry shows the problem it addressed and the check performed afterward. “Updated metadata” is vague. “Replaced the discontinued offer in the service-page description and confirmed the public output” is verifiable.
For technical work, include an affected example URL and the before-and-after behavior. For content work, link the published page and summarize the new information. For access or tracking repairs, record the date the source became reliable again.
Keep unresolved dependencies visible. If the team is waiting for product facts or client access, state what is needed and who owns the next action. Do not present a draft as a published asset or a queued fix as a completed change.
Decide what belongs in the summary
The opening summary should explain the most important result, a material limitation and the next decision. It does not need to repeat every table.
Here is a complete illustrative summary:
Organic search clicks increased from 400 to 460 in the selected period. Installation pages contributed 45 of the additional clicks. Verified quote requests increased from 12 to 13, but the available data does not establish which change produced the extra request. Next month, we will review the installation cost section and the inquiry path before expanding the supporting content.
The summary is useful without exaggerated language. It includes enough detail to check the calculation and enough restraint to preserve trust.
Review the report before delivery
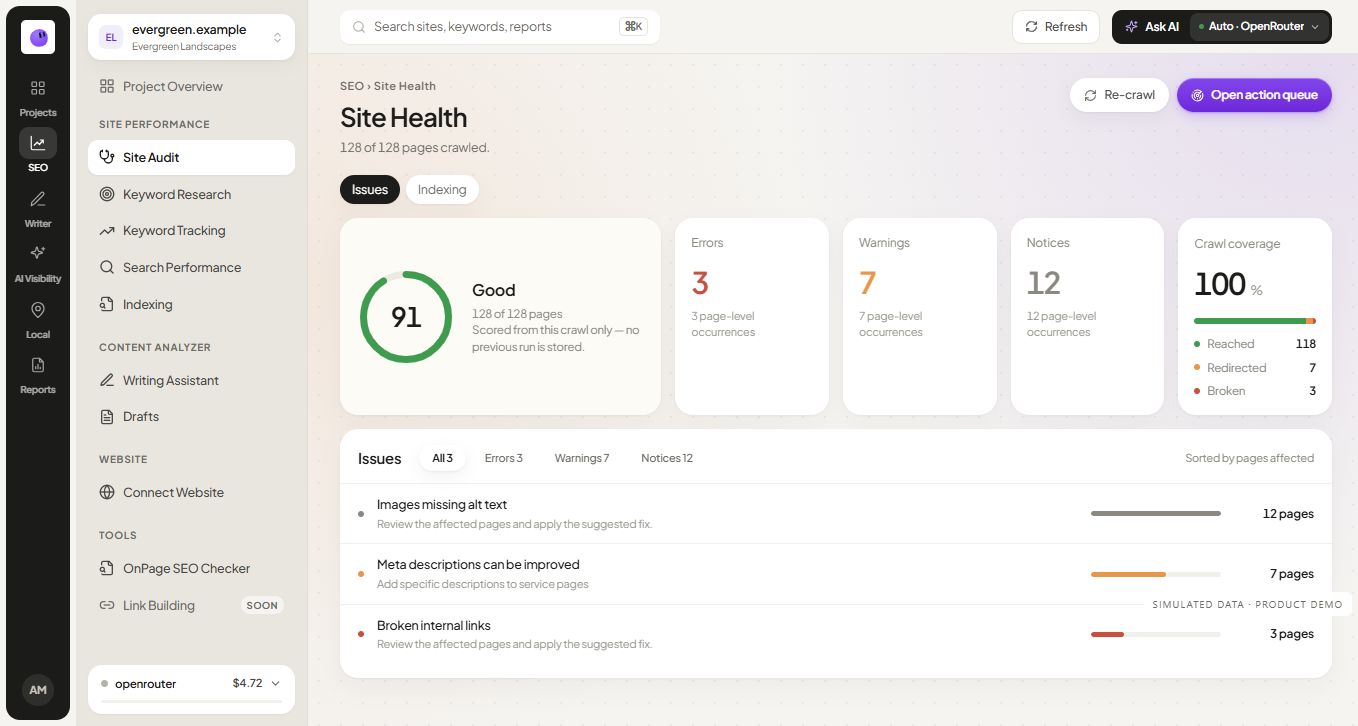
Open the final output as the recipient would. Check dates, labels, links, source freshness and the recipient list. Ensure screenshots do not expose unrelated accounts. Confirm that empty states are explained and that a disconnected source is not displayed as zero performance.
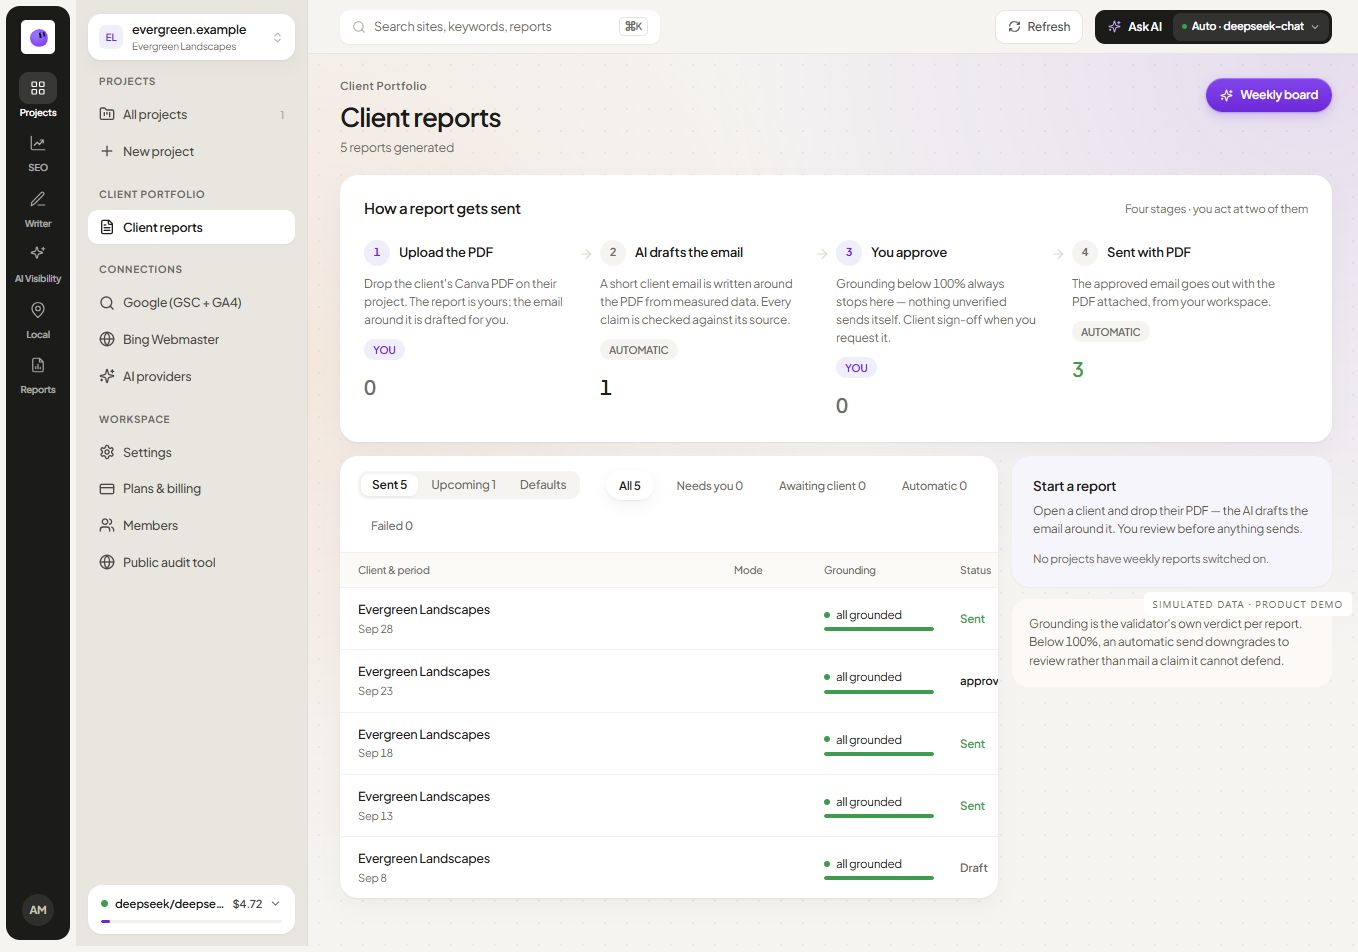
For scheduled delivery, understand how the tool handles failed connections and approvals. Test one report before enabling a recurring cycle. Keep a record of what was sent so corrections can refer to the same version the client received.
RankZap's reporting workflow brings these tasks into project context. White-label reports support presentation, while your review provides the interpretation and final factual check.
Make the next report easier
Carry forward the action register, definitions and known measurement gaps. Review whether the previous actions were completed before adding new ones. Retire charts that no longer support a decision, and explain any changed metric definition explicitly.
Keep a record of meaningful site and tracking changes alongside the reporting dates. This helps a future reviewer interpret a break in the series without inventing a cause. It also prevents the same unresolved question from appearing as a surprise every month.
Frequently asked questions
How often should I send an SEO report?
Choose a cadence that matches the decision. A monthly client summary may be appropriate for ongoing work, while a migration or a tracking fault may need more immediate monitoring. Avoid making claims from very small short-term samples.
Should rankings be the headline metric?
Only when the report's decision specifically concerns tracked searches. Rankings can help explain visibility, but the business may care more about qualified inquiries, useful visits or sales. Preserve the connection to that goal.
How much commentary does a report need?
Enough to explain material changes, uncertainty and next actions. If a chart is self-explanatory and does not change a decision, it may need only a precise label. Add prose where the reader needs interpretation.
Can AI write the report summary?
AI can help draft from supplied evidence. A reviewer still needs to verify the numbers, scope and causal language. Never let a fluent explanation stand in for a missing source.
Explore this topic
 Simulated dataSimulated dataSimulated dataSimulated dataSimulated data
 Simulated data
 Simulated dataSimulated dataSimulated data
Continue your workflow
 Simulated data