Explore the map grid · Understand local reporting
Define the question before the grid
Choose a service query that matches the business and an area relevant to its customers. A broad keyword or an unrealistic service area can produce a striking map without answering a useful business question.
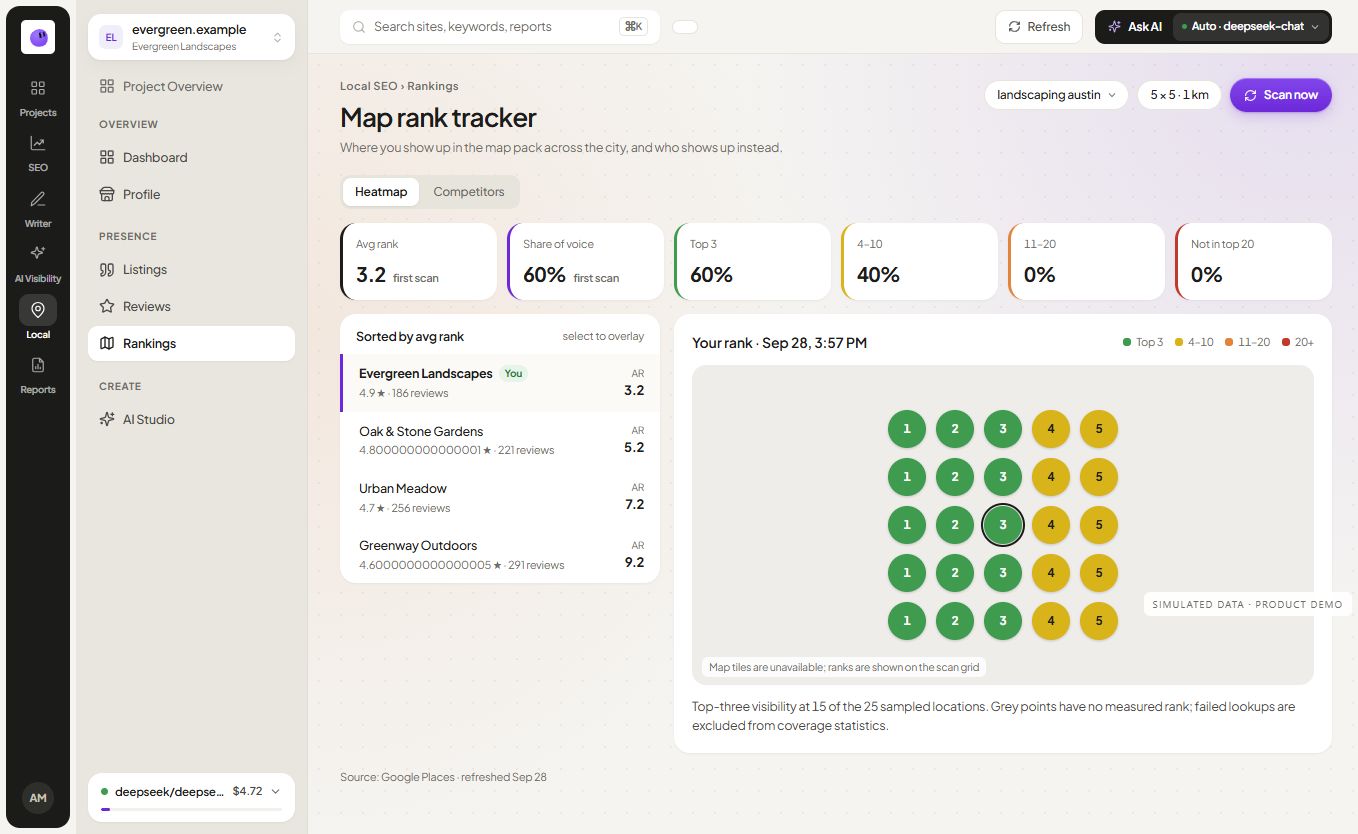
Record the business listing, keyword, center point, spacing and check date. Those settings make the result interpretable and help the next check represent the same investigation.
Read the individual points
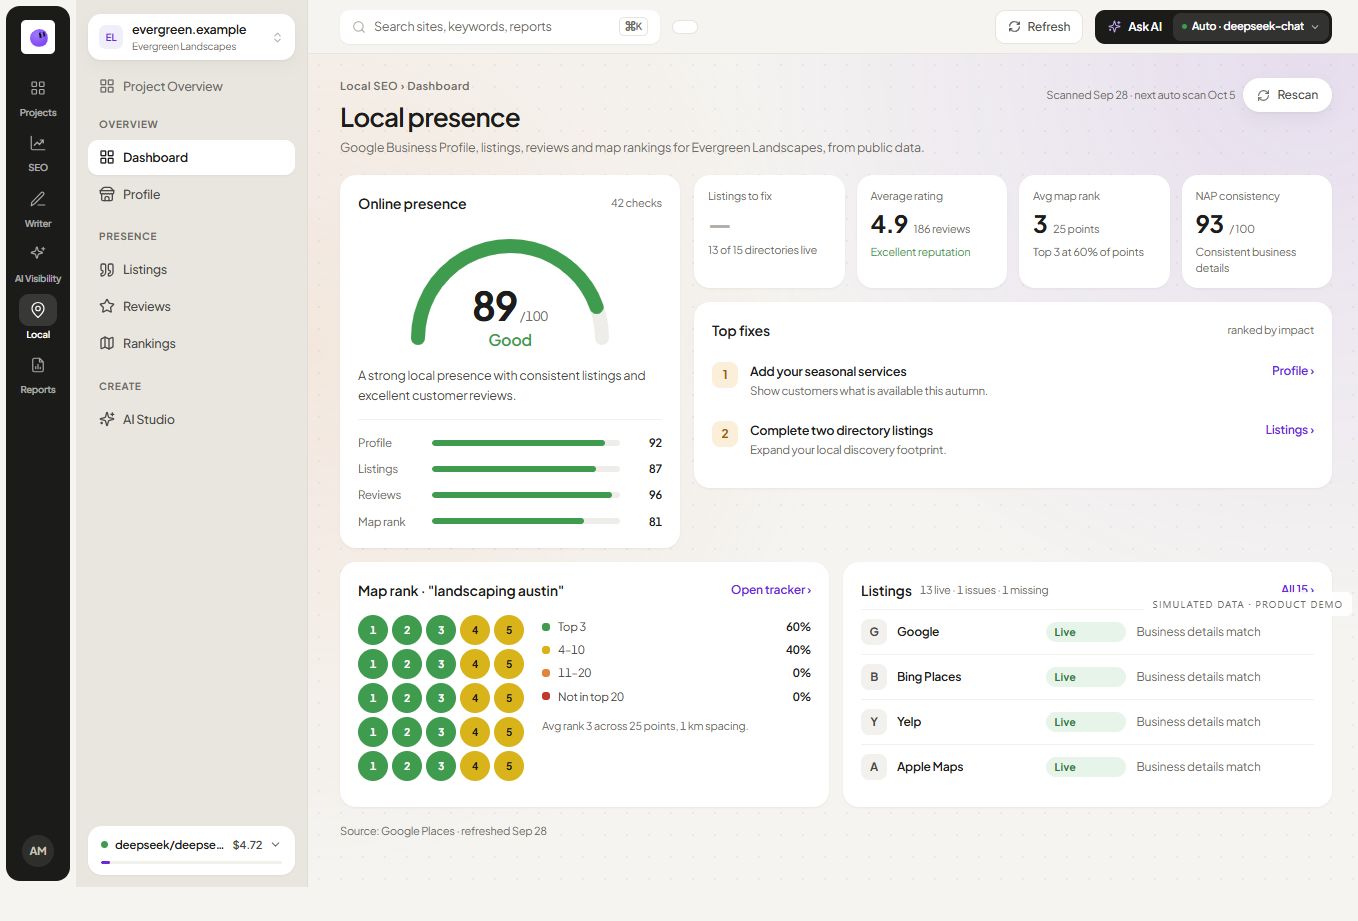
A grid shows observations at selected coordinates. Visibility can vary across the area, and one average can hide that variation. Inspect the points that matter to the business's actual service reach.
For example, a location may appear in the observed results near its address but less often farther away. That is a pattern to investigate, not proof that a particular profile edit will solve it. Review the result context and the competing businesses before recommending changes.
Compare consistent samples
Keep the keyword and grid settings stable when looking for movement. If the business moves, the service area changes or the grid is resized, label the new setup. Comparisons across different samples should not be presented as a clean before-and-after result.
| Record | Why it belongs with the result |
|---|---|
| Listing identity | Confirms the business being checked |
| Query | Defines the service or product intent |
| Coordinates and spacing | Defines the sampled geography |
| Date and source | Establishes when and how the observation was made |
Bring the map into a wider review
Use the grid alongside public listing details and the relevant website pages. The local SEO module organizes that workflow. If a landing page needs attention, use the page review to investigate its content and technical context.
Customer inquiries and visits remain separate outcomes. A map position is not a forecast of calls or revenue. Keep those distinctions clear in client reports.
Distinguish a map-grid sample from organic rankings
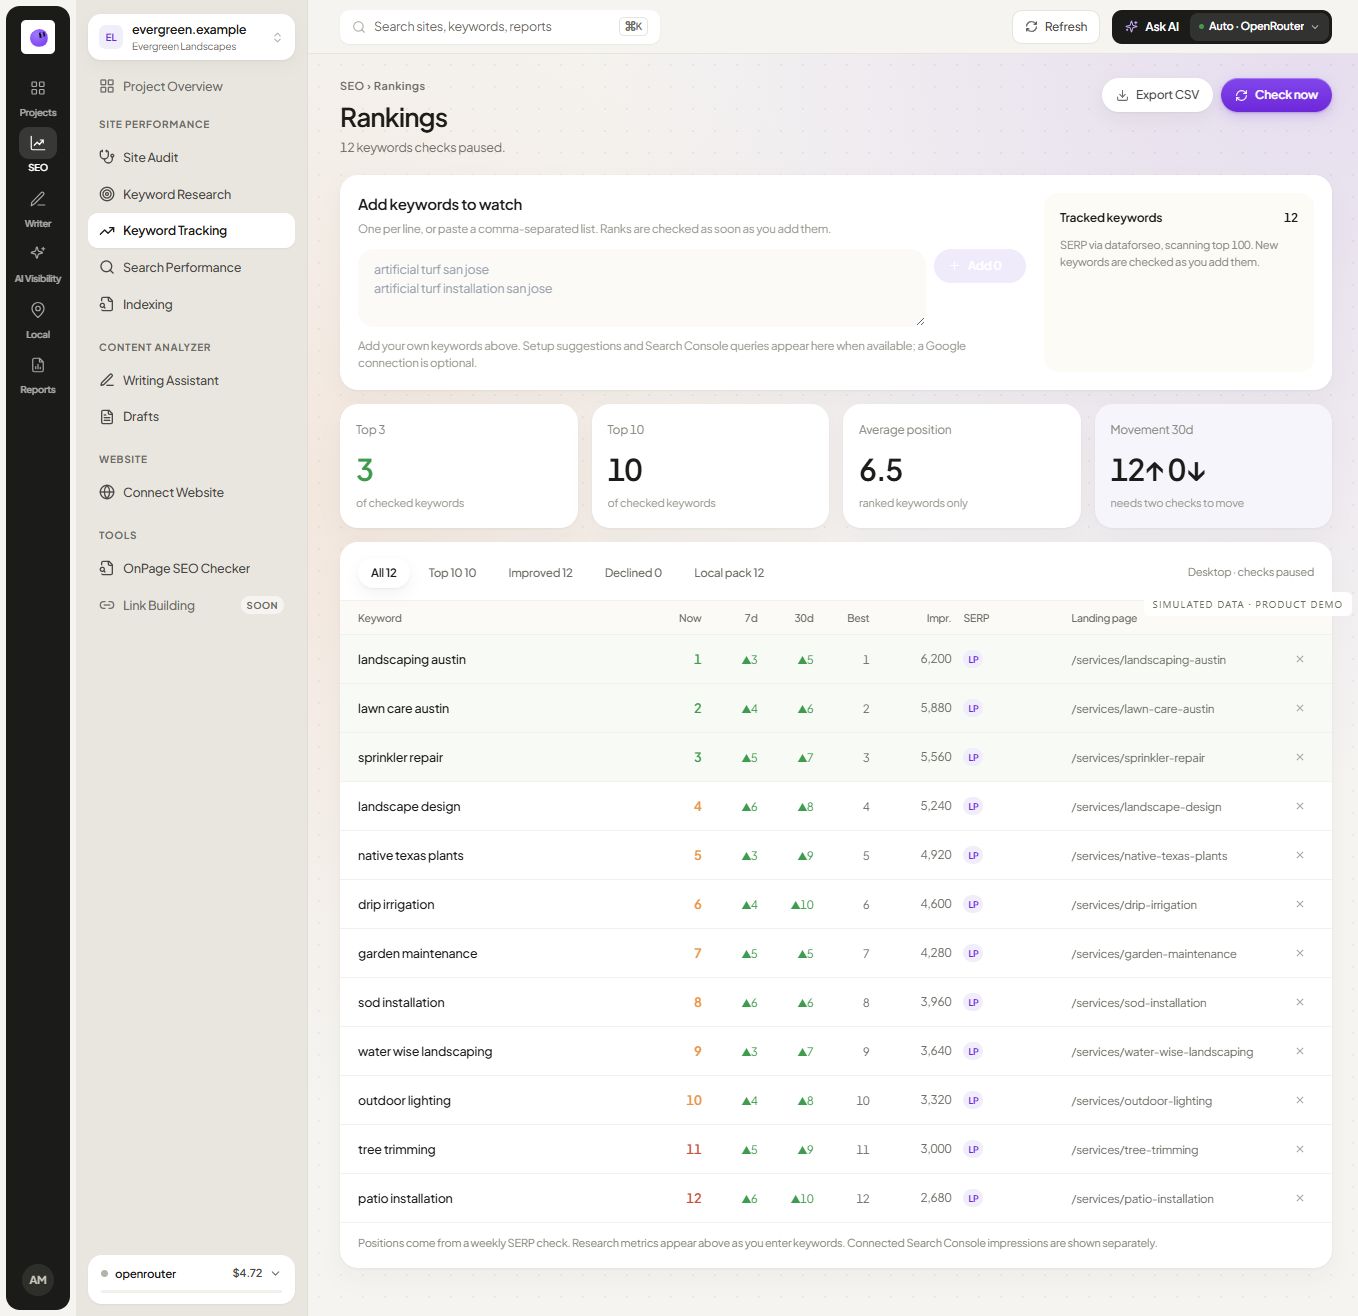
A local grid measures observations around selected coordinates for the configured source. An ordinary organic keyword tracker follows a different result type. Preserve which surface was checked instead of combining the positions into one unlabeled “Google rank.”
Read coverage with its denominator
Suppose a fictional grid attempts 25 points, 20 return usable results and eight show the business in the top three. Top-three coverage among completed points is 8/20, or 40%; completion is 20/25, or 80%. Both belong in the explanation. Five failed points are missing evidence, not confirmed positions outside the top three.
Use the actual product's documented formula when interpreting its metric; this example does not specify RankZap's scoring implementation. Keep the point-level results available so the average does not hide weak coverage in a commercially important part of the area.
Questions about map tracking
Is a grid result the same for every user?
No. It is a sample under defined conditions. Actual users can search from different places and at different times, and results can change.
Should I always choose the largest grid?
Choose a grid that answers your location question and fits the available usage. More points are useful only when you can interpret them and the area is relevant to the business.
Can I prove a change caused an improvement?
A before-and-after observation alone does not prove causation. Record other changes and keep the sampling conditions consistent before drawing a conclusion.